New In Data Studio: Color Scale Conditional Formatting
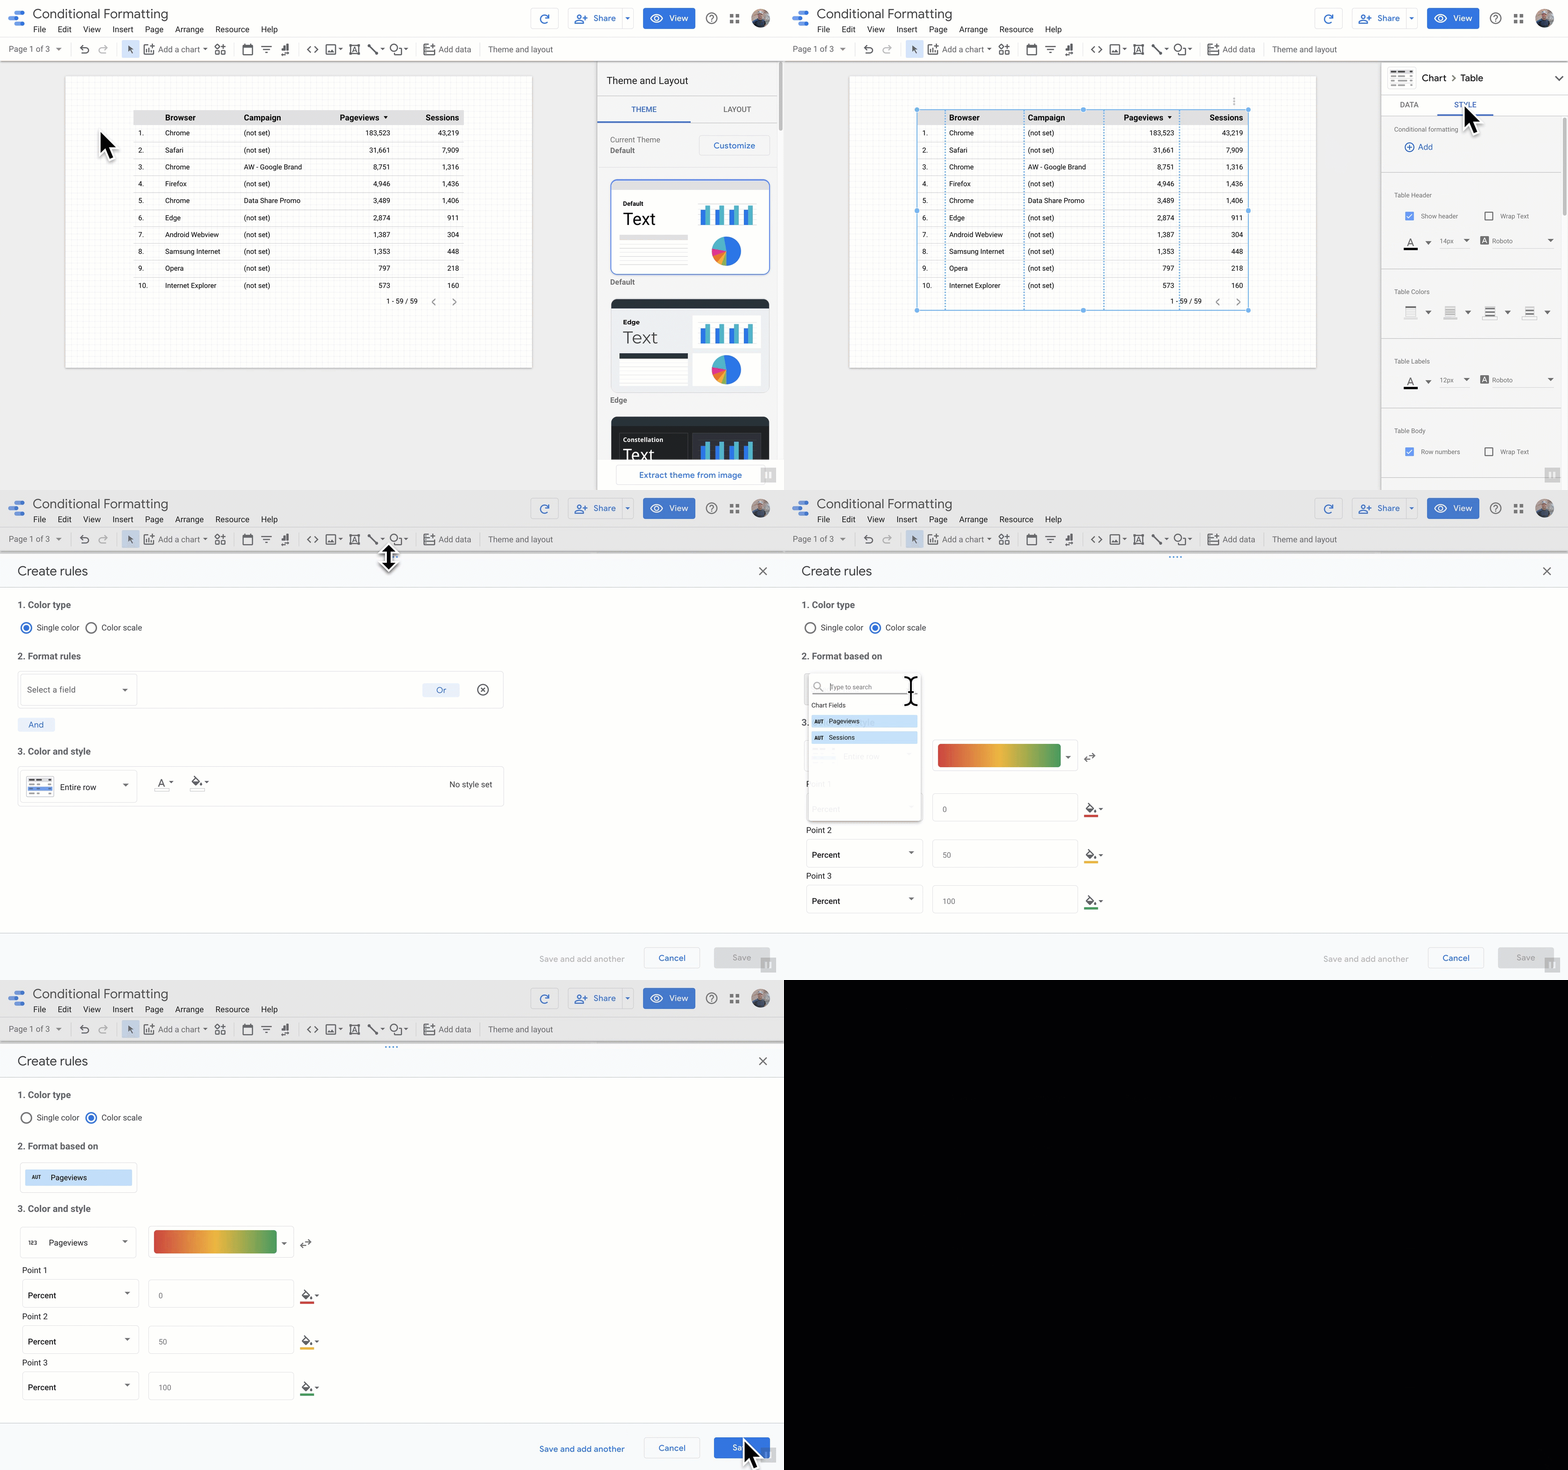
https://support.google.comConditional formatting lets you set the font and background colours used in your charts based on the data. With the new Color Scale Conditional Formatting, you can add colours to your charts that correspond to minimum, midpoint, and maximum thresholds.
To create a colour scale:
- Edit your report.
- Select a table or scorecard.
- On the right, click STYLE.
- At the top, in the Conditional Formatting section, click + Add.
- Under Color type, select Colour scale.
- Under Format based on, select a field in the chart. You can only select a single metric as the basis for a colour scale.
- Define the colour and style to apply when the format rules are met.
- Click Save.


