Create Text Based Charts You Can Directly Embed On Social Media
https://tweetable-charts.agiliq.comA chart is worth a thousand data points. Have you seen the “Year Progress” charts on Twitter? What if you can create any chart type – Bar, sparklines, tables and use it right inside the Twitter text box? Use Tweetable Charts, enter your data, and copy the chat ready to be pasted on Twitter or other social networks. They support the following charts
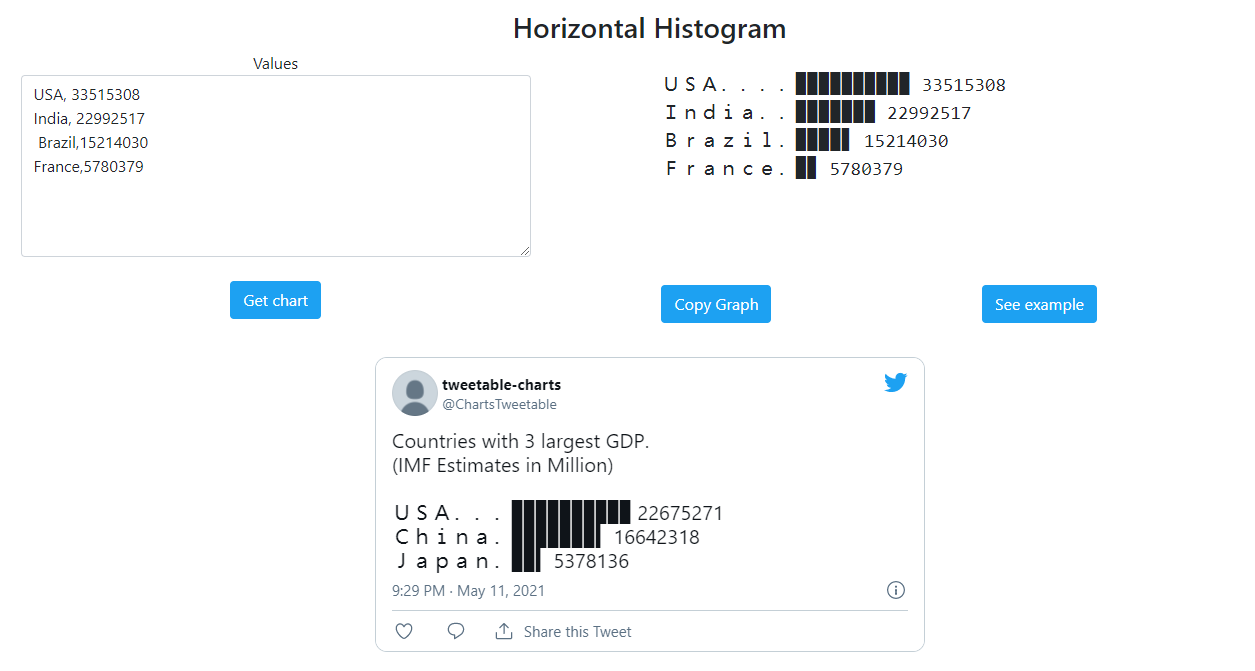
- Horizontal Histogram
- Multi Sparkline
- Multi Progress Bar
- Table
- Progress Bar
- Sparkline
- Vertical Histogram